Today we’re talking about the work that goes into writing an informative post. I like making decisions based in data. Collecting data is hard. Sometimes you have data in different formats, and it’s tempting to use Excel/LibreOffice Calc/Google Sheets (because that’s every engineer’s knee-jerk reaction to dealing with more than 100 rows of data). But today I have too much data. If I tried to do it in a spreadsheet, I would spend 5 hours slogging through it. Then if there were a mistake, I would waste all that time again going back and fixing it again. If I automate the process, a mistake can be corrected, and tried again in a few seconds.
I learned html and a small bit of php/javascript in high school, c++ in college. I almost exclusively deal with c++ and ada, and see a miniscule bit of fortran. I don’t write code, I look at other people’s code, and even then that’s only about 20% of what I do.
So I decided to try and pick up python over winter break. I’ve been pleasantly surprised so far. I know it’s slower than c++, but it’s so incredibly easy to work with. I still need some work on my python, and this is a better learning exercise than the little “projects” in the online classes.
The goal:
Compare data from 3 locations to see how efficient/inefficient our back fireplace is (the wall is uninsulated, the fresh air intake is leaky, and the flue is leaky).
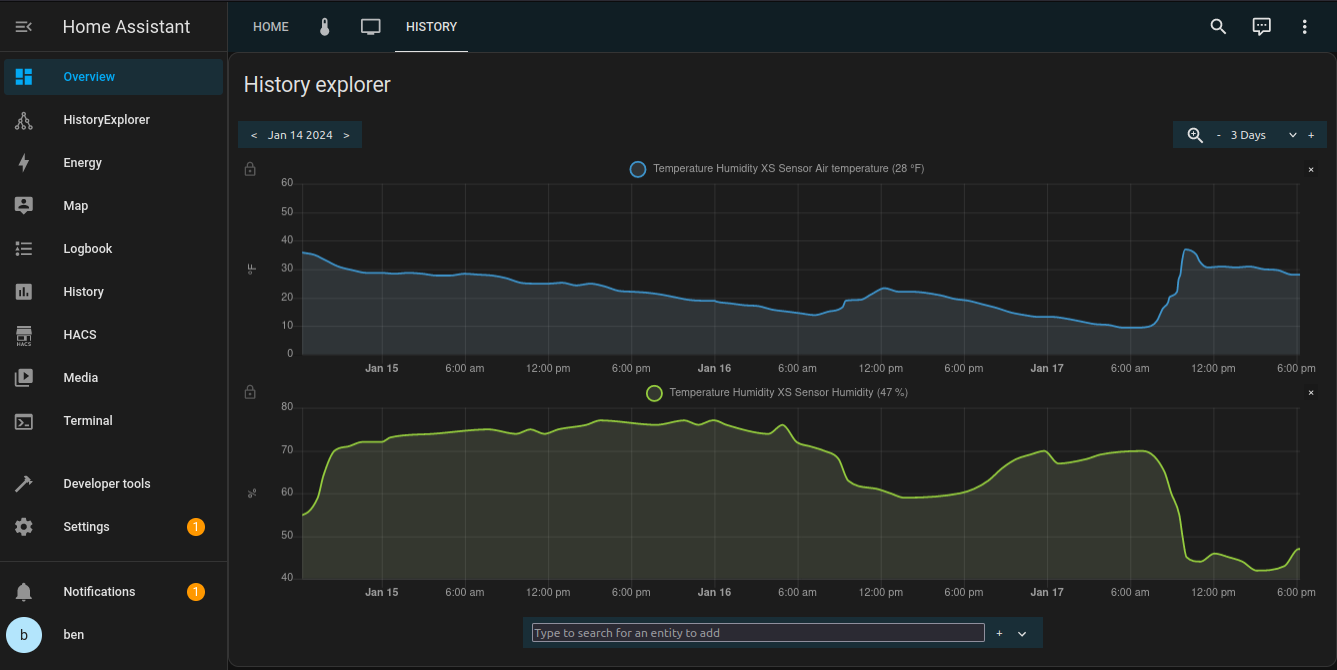
Outside – I’m using a z-wave temperature/humidity sensor on the back porch. I view the data with the History Explorer Card integration, because the built in HA history tools suck. This allows me to output as a .csv.
Inside the house – I don’t have a smart thermostat. So I’m using a DHT11 temp/humidity sensor hooked up to an arduino. Every 30 seconds the arduino polls the sensor, then sends an ASCII printout of temp/count over serial to my laptop. Plug it in overnight, use moserial to save to a .log file. Then anchor some count # to a real date and time.
Right up against the fireplace glass – Same DHT11 process, just trying to get an accurate surface temperature to do some rudimentary heat transfer calcs.
Preliminary Input:
Here’s what I get from HomeAssistant
And here’s what I get from the arduino. The formatting issues here are my own failures. I should have thought about what would be useful before I set it to run overnight. Oh well.
Date:Time:Count:Temp
14jan24:2024:231:53.06°F
::232:53.06°F
::233:53.06°F
::234:52.70°F
::235:52.34°F
::236:52.16°F
::237:51.98°F
::238:51.62°F
::239:51.62°F
I want to plot both of these on the same graph, and do a bit of math on them. But the timestamps are wildly different. Outdoor I’m getting one data point each hour (to not replace a battery every week). Inside I’m getting data every 30 seconds. So ~120 arduino readings for every HomeAssistant reading.
Intermediate Processing:
First I put each log file into LibreOffice Calc (free excel clone for linux) and get a human readable date time group (DTG) in “yyyy.mm.dd hh:mm:ss”. That’s simple enough with some formulas, which I will not go into great depth on here. Lots of left(, right(, and concatenate( formulas in separate columns.
But when I make a graph the data gets stretched when I have periods of time with more than one set of temperatures. That’s because it doesn’t recognize the DTG, so it’s just counting everything up in series, and doesn’t have any sense of scale on the x-axis.
So what I need is some universal counter to use for x scale. Let’s use linux epoch time, which for those unfamiliar, is an integer that represents the number of seconds past December 30th 1899.
First take your nice DTG and copy it. Paste into new cells “right click >> paste special >> unformatted text”. Now we can tell it that delimiters are -, space, and : . Now each item is in its own column as ASCII numbers.
First figure out the number of days past our special date with “=date(current date) – date(special date)”. Then tally up the seconds in the day after midnight “=hours(need to be in military time) * 3600 + minutes * 60 + seconds”. Combine the two multiplying the date epoch by the number of seconds in a day (86,400), add in the time portion for the day, then subtract the number of hours off you are from GMT (-6*3600) for me.
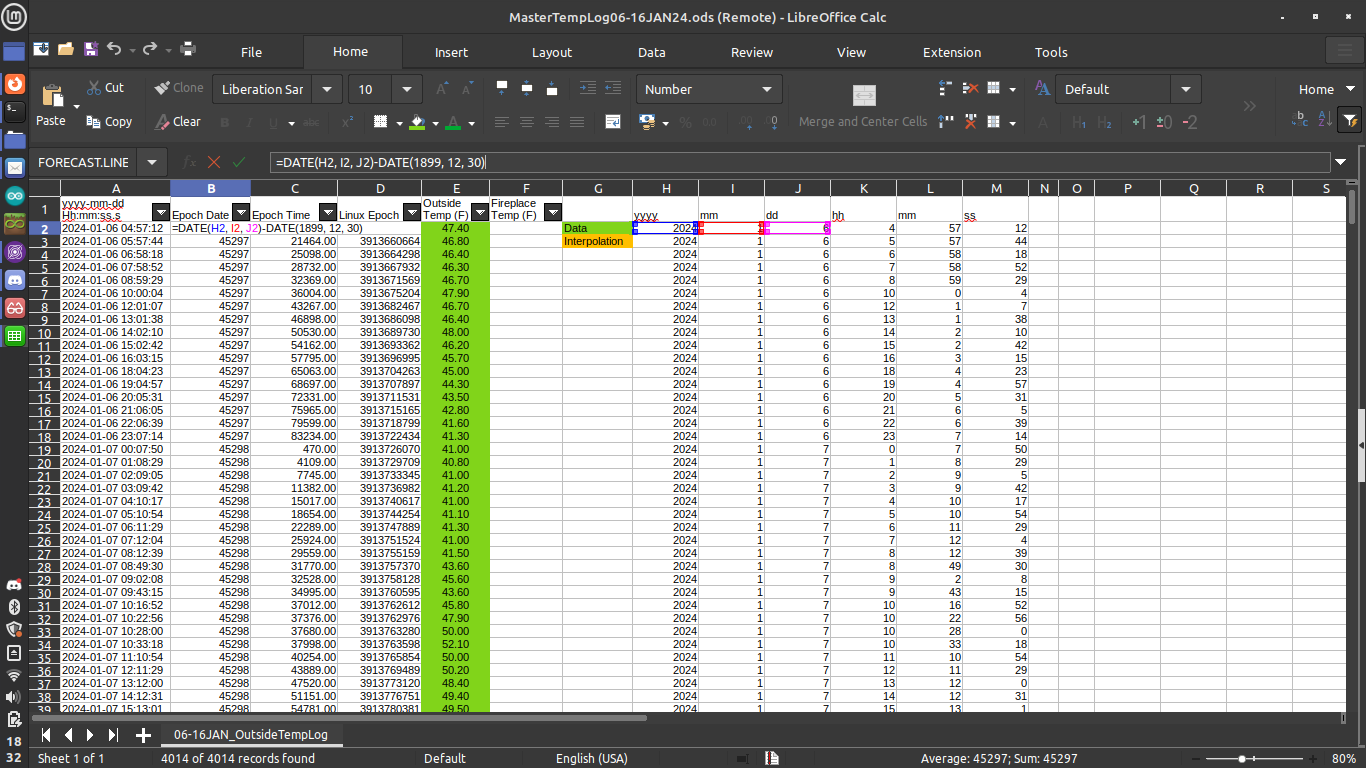
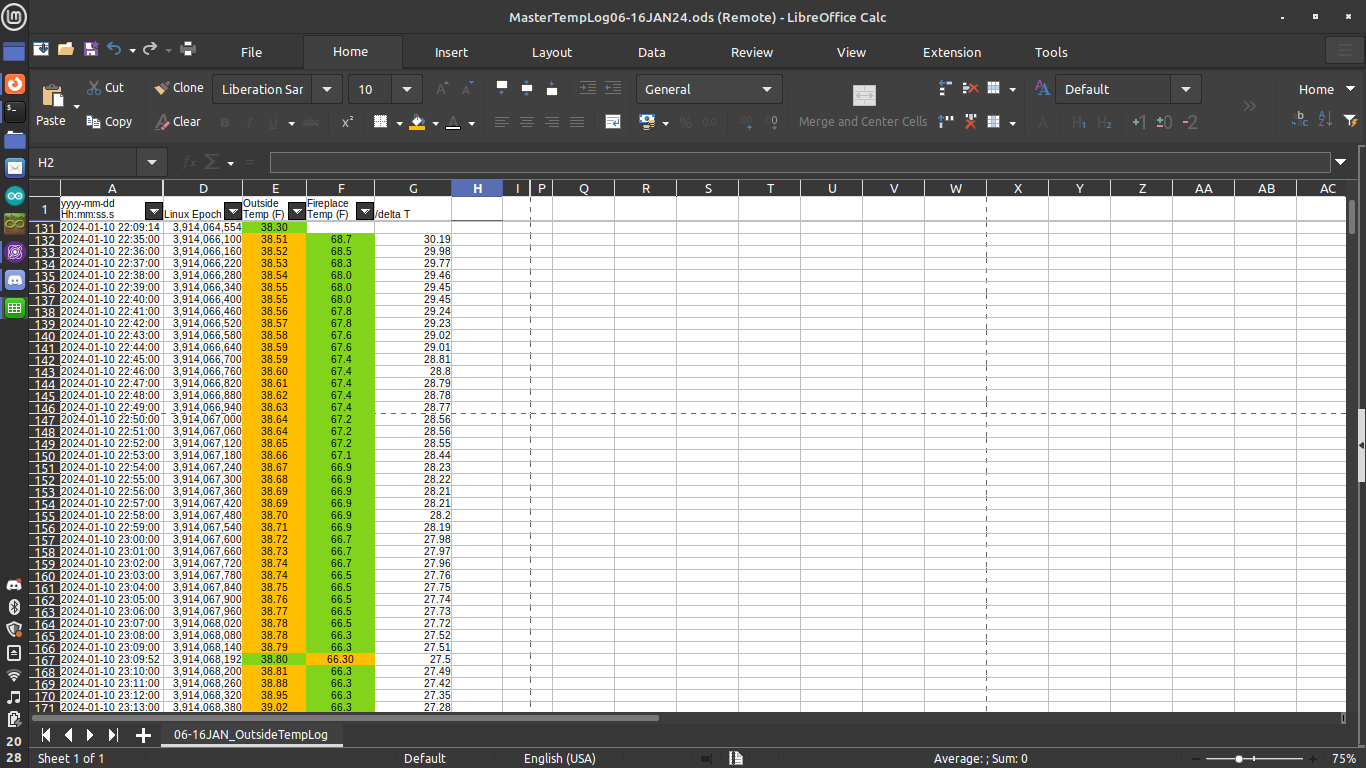
Now we have a human readable DTG, and linux epoch will be used for sorting. Outdoor temps are in one column, and fireplace temps are in another (the room was pretty consistently 3F below setpoint, so we’re not getting that detailed).
Final Processing:
The final thing we have to do is interpolate the outdoor temperatures, so we have something to use for finding the temperature gradient through the wall/fireplace. I can’t do that if one field is blank. And no matter where I am, one or the other will be blank (unless I was able to get readings from both sources within 1s of each other).
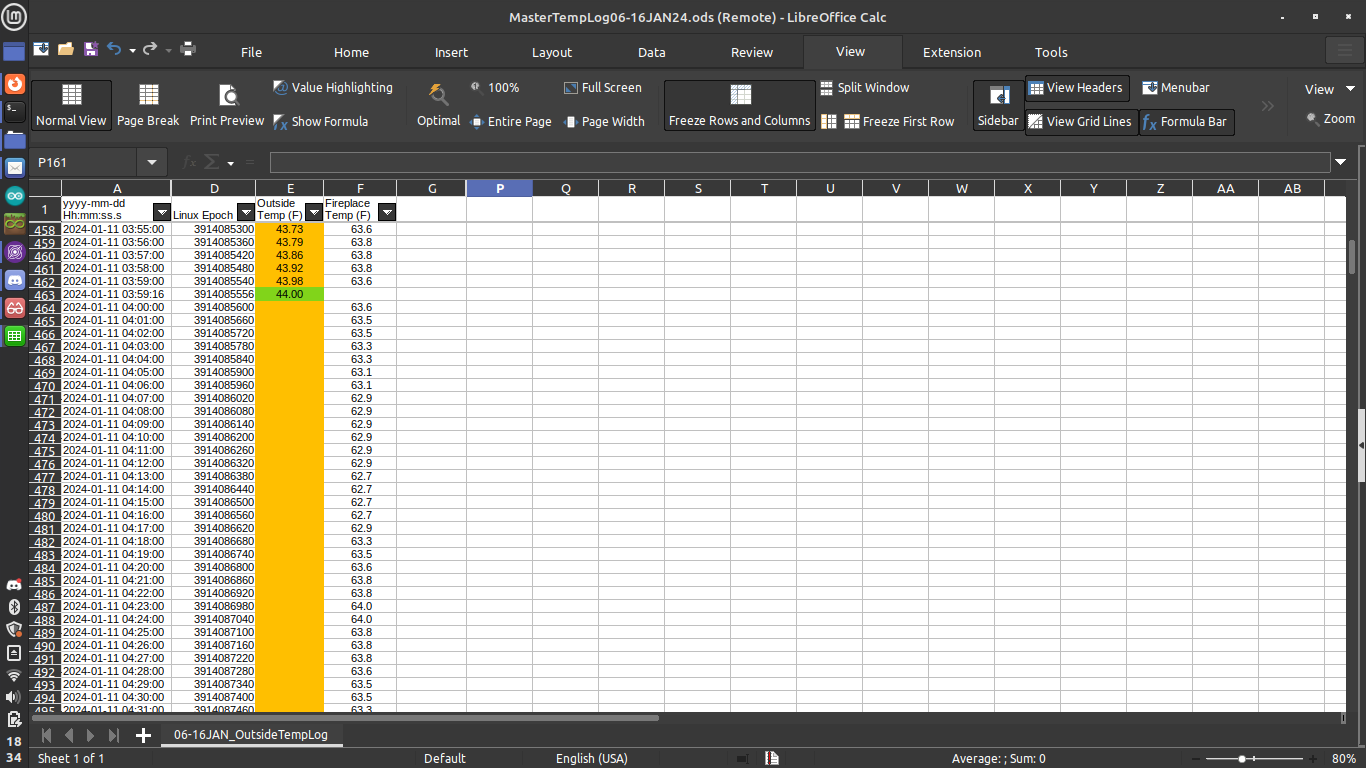
First we filter our temperatures to omit (empty), and turn the cells green so we know it’s actual data. Then we filter the inverse, and color them amber so we know it’s interpolated. There were no good formulas for this. What I want to do is find the x (time) and y (temp) values immediately before and immediately after a large group of blank values, then use them to do a linear regression in the middle automatically, rather than for each individual cell.
There’s a forecast.linear function, but that wants 2+ x values, 2+ y values, and the current x value. It will only accept arrays preceding your targeted empty values, so it’s not really an interpolation, and will over/undershoot your end value of each section. Creating your own formula is possible, but there’s no way I’m learning all of that, for a tool that will only be useful in one application. I’m not writing a VBA macro, for the same reason. I got through about 3 iterations worth before giving up inside the spreadsheet. The process consisted of copying the formula into the first blank, search for the ending blank, manually edit the cell values in the formula (6x values, 3-4 digits for each since we have just over 4k data points), then propagate it down to the next known, then repeat. I had over 12 hours of data one night, and am planning on analyzing at least 2 nights worth…have something like 65 sections that need to be interpolated.
Let’s get the data into an array, then use python to deal with it. I copied the cells I wanted, and pasted them into a text file. I’m using pulsar. You can use notepad, notepad++, emacs/vim/nano, microsoft word probably. Do what you want. Just use the find/replace tool to get it into a specific format “[[time1, temp1],[time2, temp2]…[time_n, temp_n]]”. This is what python will want for a n*2 array.
All I’m doing is declaring my variable, as a list of lists. The inner list will be either length 1 (time only) or 2 (time, temperature). Something like c++ would force you to allocate memory and make a full n*2 array, then fill missing temp data with zeroes. But python will let you make a n*1 list, then make each element in there different lengths, types of data, etc. (very helpful sometimes, but I’m used to c++ and ultimately this frustrates me).
The process will be the following:
- Declare our variable, all 4k elements (in the future I’ll figure out how to just grab a .csv)
- Sort the list by time, if it isn’t already
- Step through the array from start to end
- Put time value into a new array
- Put temp value into a new array, or if unknown, mark it as something we’d never see in this climate (-50)
- If I happen to be entering a group of blank data, save a start index
- If I happen to be leaving a group of blanks into known values, save an end index
- append start and end into a separate list of sections that must be fixed
- While my list of sections to fix is non-zero
- Pull the start and end indices from the beginning of that list
- Feed those into my function
- Pull the x/y immediately prior to and immediately following the range
- Do the linear regression math for each item in that section, modifying the temperature list
- Close out the section, increment some counters
- Zip the two intermediate lists back into one final list that and print in a format that’s useful to put back into the spreadsheet
Which looks like this:
# a ton of data, for real, longer than the rest of this post
rawData = [[1, 1],[2,],[3,],[4,],[5,2]
#if not apparent, the end result would be [[1,1],[2,0.5],[3,1],[4,1.5],[5,2]]
#to track our progress
inASegment = False
segmentsToAddress = []
beginMarker = 0
endMarker = 0
segment = 1
#intermediate data storage
epoch = []
rawTemp = []
#make sure we're sorted. for a list of lists, only the first value will be used for each sub-list to be evaluated
rawData.sort()
#go through it once and build our list of actions to complete
for i in range(0, len(rawData)):
    epoch.append(rawData[i][0]) #separate out time values into their list
    #if temp data missing from second index of list
    if len(rawData[i]) == 1:
        rawTemp.append(-50)
        #moving from known temps into unknown temps
        if inASegment == False:
            inASegment = True
            beginMarker = i #index of the first unknown
    #if temp data exists in second index of list
    elif len(rawData[i]) == 2:
        rawTemp.append(rawData[i][1]) #put in existing value
        #if breaking out of a segment
        if inASegment == True:
            inASegment = False
            endMarker = (i - 1) #index of next known, so want the previous which is empty
            segmentsToAddress.append([beginMarker, endMarker])
            print("Segment " + str(segment) + " consists of indices " + str(beginMarker) + ":" + str(endMarker))
            segment += 1
#given a range needing values. Pull x/y known values from each end, then fill in linearly
def interpolateSection(segmentBegin, segmentEnd):
    #rise
    yi = rawTemp[segmentBegin - 1]
    yf = rawTemp[segmentEnd + 1]
    #run
    xi = epoch[segmentBegin - 1]
    xf = epoch[segmentEnd + 1]
    #calculate slope once, won't change for an entire segment
    slope = ((yf - yi)/(xf - xi))
    for j in range(segmentBegin, segmentEnd + 1):
        rawTemp[j] = round((yi + ((epoch[j] - xi) * slope)), 2) #initial + (delta_x)*(slope)
#main loop, go through segments one by one until there's nothing left to fix
while len(segmentsToAddress) > 0:
    interpolateSection(segmentsToAddress[0][0], segmentsToAddress[0][1])
    segmentsToAddress.pop(0)
print("Entire list is complete!")
finalData = zip(epoch, rawTemp)
#figure out how to take in a .csv file and update it directly in the future
for item in finalData:
    print(str(item))
Result:
The code has minimal outputs for debugging. And copy/pasting data from terminal is painful.
# python interpolate.py
Segment 1 consists of indices 130:164
Segment 2 consists of indices 166:194
Segment 3 consists of indices 196:256
...
Segment 62 consists of indices 3760:3880
Segment 63 consists of indices 3882:3994
Entire list is complete!
(3913657032, 47.4)
(3913660664, 46.8)
(3913664298, 46.4)
...
(3914500090, 19.0)
(3914503730, 18.5)
(3914507371, 18.0)
Here’s the data filled in. It’s useful to have the epoch time output, so you can make sure it all still lines up with the original data.
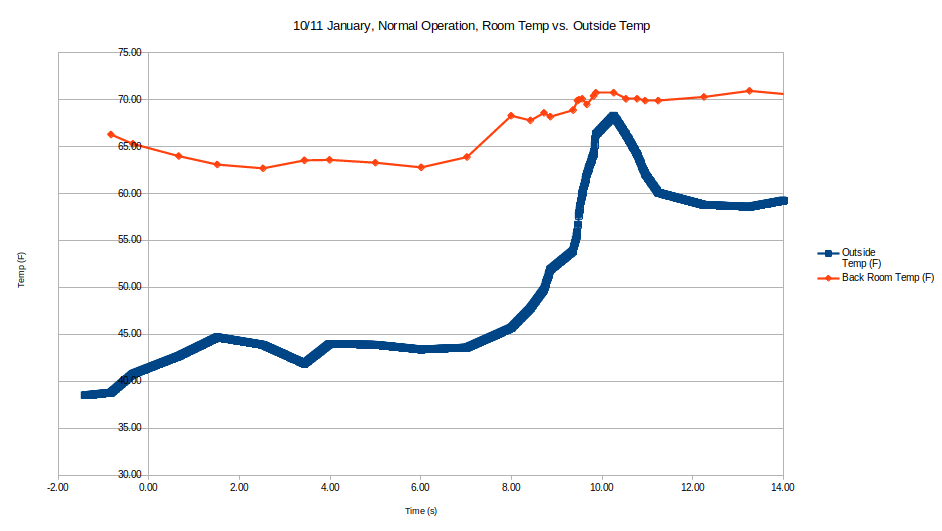
Here’s the graph of the first set of data I grabbed. Just the temp in the middle of the room at shoulder height vs. outdoor. The setpoint on the thermostat was 72 until about 10pm (-2 relative to midnight on the x-axis), and 68 at night.
So for a moderately cool night, the back room gets 5-10 degrees colder than it should. A good amount of insulation has been added to the attic (not entirely complete), ceiling protrusions have been sealed with foam (almost 100% complete), and one of two windows have been replaced. The fireplace is the main contributor to the cold room.
In the next post I’ll put in data from a few other nights. I.e. the temperature right up against the steel grate/glass of the fireplace, which is ~20 degrees colder than the room at any given time. Then some data for afterwards to see if what I did was effective. As well as the actual fix, because by the time I’m writing this I’ve already gone through with it all and am getting around to the hard part (documentation) afterwards.
Leave a Reply